The short answer
The quinoa glycemic index is about 53 for cooked quinoa, which counts as low (55 or under) on the University of Sydney’s scale. By our math, a 1-cup serving (185 g) has a glycemic load of about 18, which is medium. In the international GI tables, boiled white rice averages 73 and brown rice 68.
What is the glycemic index of quinoa?
The glycemic index (GI) ranks carbohydrate foods by how much they raise blood sugar compared with pure glucose, which scores 100. To test a food, a lab feeds it to 10 people and compares their blood sugar curves with the curves they had after taking glucose on separate days. The Glycemic Index Foundation at the University of Sydney sorts the results into three bands:
- Low GI: 55 or less
- Medium GI: 56 to 69
- High GI: 70 or more
The same foundation lists half a cup (90 g) of cooked quinoa with a GI of 53. That puts the GI of quinoa in the low band, a couple of points under the cutoff. In British and Australian spelling it’s the glycaemic index, the same measure. Note that 53 is an average from testing. Your own blood sugar response can land higher or lower.
Glycemic load of quinoa per serving
GI compares foods at the same amount of carbohydrate, so it says nothing about the size of your portion. Glycemic load (GL) adds that in: GL = GI × grams of available carbohydrate in the serving ÷ 100. The GI Foundation rates a serving’s GL as low at 10 or under, medium at 11 to 19, and high at 20 or more.
We calculated the GL of cooked quinoa with a GI of 53 and the carbohydrate data from USDA FoodData Central. For available carbohydrate we used total carbs minus fiber, about 18.5 g per 100 g.
| Cooked quinoa | Grams | Available carbs | Glycemic load | Rating |
|---|---|---|---|---|
| 1/3 cup | 62 g | 11 g | about 6 | Low |
| 1/2 cup | 93 g | 17 g | about 9 | Low |
| 100 g | 100 g | 18.5 g | about 10 | Low |
| 3/4 cup | 139 g | 26 g | about 14 | Medium |
| 1 cup | 185 g | 34 g | about 18 | Medium |
Source: our calculation (GI 53 from the GI Foundation; carbs and fiber from USDA FDC 168917; 1 cup = 185 g), rounded.
The GI Foundation’s own worked example puts 1 cup of cooked quinoa (190 g) at a GL of 16, so a full cup lands at about 16 to 18. Either way, the portion moves the GL far more than the GI does. For calories, protein and the rest, see quinoa’s full nutrition facts per 100 g.
Quinoa vs rice glycemic index
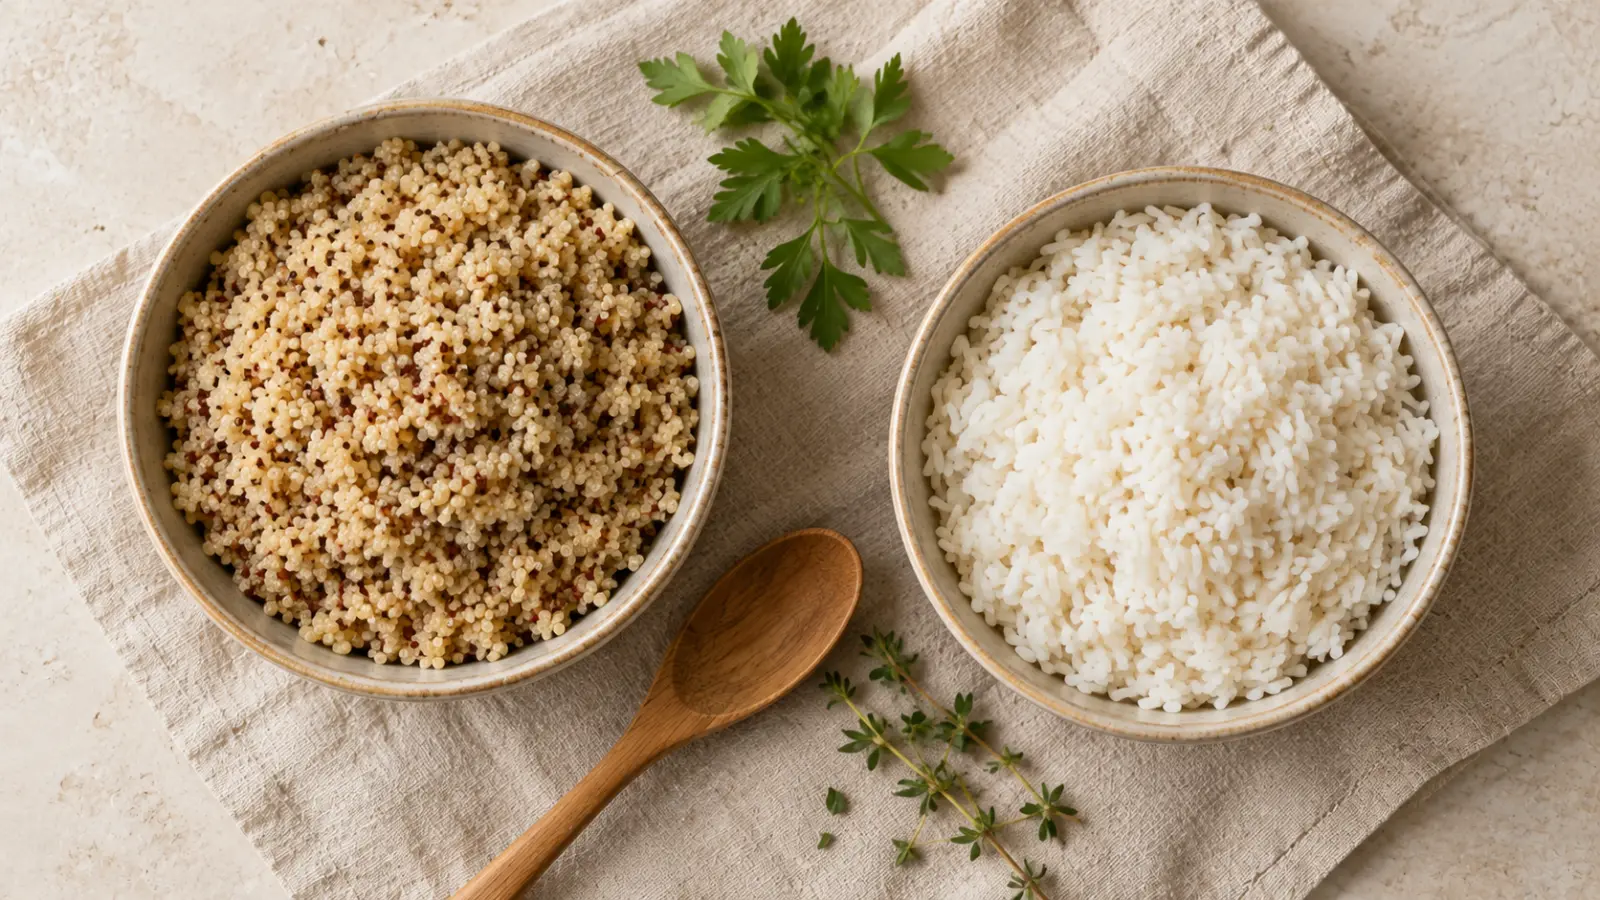
In the 2008 international GI tables, boiled white rice averages 73 ± 4 and boiled brown rice 68 ± 4. Quinoa, at about 53, is lower than both. The rice figures are averages over many varieties. The same tables note that low-GI white rice varieties exist, and the 2021 update found rice in high-, medium- and low-GI versions.
| Cooked food | GI | Cup weight | Available carbs per cup | GL per cup | GL per 150 g |
|---|---|---|---|---|---|
| Quinoa | about 53 | 185 g | 34 g | about 18 | about 15 |
| White rice, boiled | 73 ± 4 | 158 g | 44 g | about 32 | about 30 |
| Brown rice, boiled | 68 ± 4 | 202 g | 48 g | about 33 | about 24 |
Sources: GI from the GI Foundation (quinoa) and Atkinson 2008 (rice); carbs, fiber and cup weights from USDA FDC 168917, 168878 and 169704; GL is our calculation, rounded.
The gap in glycemic load is wider than the gap in GI. That’s because a cup of cooked quinoa also carries less carbohydrate than a cup of either rice: 39.4 g of total carbs against 44.6 g for white rice and 51.7 g for brown.
So is quinoa better than rice for blood sugar? On GI and GL, a cup of quinoa should raise blood sugar less. Those numbers come from each food eaten on its own, though. In a real meal, the portion, what else is on the plate and your own metabolism all shift the result.
What changes quinoa’s glycemic response
A GI value belongs to a food prepared a certain way. According to the GI Foundation, two things push it up for starchy foods in general:
- Overcooking. Cooking starch for longer raises its GI.
- Fine milling. Grinding a grain into flour gives digestive enzymes more surface to work on, so it’s digested faster.
Portion is the third factor, and the glycemic load table above shows how much it matters.
Quinoa flour and baked goods
We couldn’t find a published GI for 100% quinoa flour or for bread made only with it. The closest reliable figure is for a wrap made with wholemeal and white wheat flour plus red quinoa. Tested in 10 healthy adults in Australia, it had a GI of 59 ± 5, according to the 2021 GI tables. That wrap is mostly wheat, so it says little about quinoa flour itself, and the 53 for cooked whole quinoa can’t simply be assumed for quinoa flour or for baked goods.
What studies in people show
A 2024 systematic review pooled 7 small trials in 258 adults who ate 15 to 50 g of quinoa a day for 4 weeks to 6 months. It found no change in body weight or BMI and a dose-related pattern in fasting blood sugar, and the authors called for more studies. A separate one-year randomized trial from China, published in 2023, enrolled 138 adults with impaired glucose tolerance, a stage before type 2 diabetes. The quinoa group was asked to replace at least half of their refined rice or white flour with about 100 g of quinoa a day. The control group made no change to its staple foods.
- Blood sugar 2 hours after a glucose test: 8.65 mmol/L with quinoa vs 9.57 mmol/L in the control group.
- HbA1c: 5.79% vs 6.03%.
- Fasting blood sugar: no significant difference.
- Progression to diabetes: 5 of 64 people (7.8%) in the quinoa group vs 14 of 69 (20.3%) in the control group.
The trial has real limits. It ran at a single center, and the paper doesn’t say anyone was blinded. Only the quinoa group was supplied with quinoa and had weekly blood sugar checks, which could have changed other habits too. The text also contradicts itself in places. It suggests that swapping refined staples for quinoa helped this group. It doesn’t prove that quinoa prevents or treats diabetes, and it hasn’t been repeated in other populations.
How to eat quinoa with blood sugar in mind
- Measure the portion. Half a cup of cooked quinoa has a GL of about 9. A full cup is about 18.
- Count it as a carb serving, like rice or pasta.
- Don’t overcook it. Stop as soon as the grains are tender.
If you have diabetes or take medicine that lowers blood sugar, stick to the plan you’ve agreed with your doctor or dietitian. GI and GL are useful guides, but your own readings matter more. If you also follow a low-FODMAP diet, check whether quinoa is low FODMAP.
Frequently asked questions
Can people with diabetes eat quinoa?
Yes. It fits a diabetes meal plan the way other starchy foods do, counted as carbohydrate. Its GI is low, but a full cooked cup still carries about 34 g of available carbs and a medium glycemic load. Smaller portions keep the load low, and your own meter readings show best how quinoa affects you.
What grain has the lowest glycemic index?
Of the grains and grain foods in the main table of the 2008 international GI tables, barley has the lowest GI, at 28 ± 2. Corn tortillas (46 ± 4) and white and whole-wheat spaghetti (48 to 49) come next. Quinoa, at about 53 (from the GI Foundation), sits just below the low-GI cutoff, while boiled white rice averages 73. How a grain is processed and cooked can move these numbers.
Is quinoa or oatmeal better for blood sugar?
It depends on the oats. In the 2008 GI tables, porridge made from rolled oats averages 55 ± 2, close to quinoa’s 53. Instant oat porridge averages 79 ± 3, which is high. Rolled-oat porridge and quinoa land in a similar range. The type of oats and the size of your bowl matter more than the choice between the two grains.
Does red or black quinoa have a different glycemic index?
We didn’t find published GI values for red or black quinoa cooked on their own. The 53 figure is for cooked quinoa with no color given. The only tested product with red quinoa in it is a wheat-based wrap, which mostly reflects the wheat. Different colors may behave a little differently, but no reliable data shows it yet.
Shop Peruvian quinoa flour
We sell quinoa as flour, bought in Peru; the GI figures above are for cooked whole quinoa, so treat our quinoa flour like any other flour when you count carbs.
- Best seller

Sources
- Glycemic Index Foundation, University of Sydney. FAQs; Foster-Powell K, 2021. Lowering the GL with smarter carb choices; and Barclay A, 2021. How to enjoy a moderate glycemic load diet. glycemicindex.com.
- Atkinson FS, Foster-Powell K, Brand-Miller JC, 2008. International tables of glycemic index and glycemic load values: 2008. Diabetes Care 31(12):2281–2283.
- Atkinson FS, Brand-Miller JC, Foster-Powell K, Buyken AE, Goletzke J, 2021. International tables of glycemic index and glycemic load values 2021: a systematic review. American Journal of Clinical Nutrition 114:1625–1632.
- USDA Agricultural Research Service, 2019. Quinoa, cooked (FDC ID 168917); white rice, enriched, cooked (168878); brown rice, cooked (169704). FoodData Central, SR Legacy.
- Atefi M, Heidari Z, Shojaei M, Askari G, Kesharwani P, Bagherniya M, Sahebkar A, 2024. Does quinoa (Chenopodium quinoa) consumption improve blood glucose, body weight and body mass index? A systematic review and dose-response meta-analysis of clinical trials. Current Medicinal Chemistry 31(4):502–513.
- Zeng H, Cai X, Qiu Z, Liang Y, Huang L, 2023. Glucolipid metabolism improvement in impaired glucose tolerance subjects consuming a quinoa-based diet: a randomized parallel clinical trial. Frontiers in Physiology 14:1179587.